Building a Crypto Price Predictor with GCP - Part 3 - Combining HYPE and Financial Data
What do you think will be more relevant, HYPE or Interest Rates?

One thing about market prices is that they aren't always objective.
Prices often reflect what we, as humans, choose to value them at, and that value can easily be swayed by abstract forces like HYPE or FOMO.

Unlike traditional markets, which are often driven by tangible factors like supply chains, earnings reports, or interest rates, crypto prices can swing dramatically based on sentiment.
A surge in interest, a tweet from a popular figure, or even an internet rumor can send prices skyrocketing—or crashing (yes, Elon, I'm looking at you).
That being said, traditional indicators like interest rates and inflation do probably have an influence crypto prices.
What do you think will be more relevant, HYPE or Interest Rates?
In this post, we’ll show how we're integrating these factors into our prediction model by using the Google Trends API for search data and the Yahoo Finance API for financial metrics.
While the last post covered API data retrieval, today we’ll focus on how we combine and preprocess the data for deeper insights.

Haven't read the previous post yet? Check it out!
A Recap of What We Have Achieved So Far
As of today, we’ve completed our MVP's external data retrieval phase.
Along the way, we encountered challenges that led to adjustments in our original plan.
Instead of extracting Reddit sentiment data, we used Yahoo Finance indicators instead.
Here’s an overview of our current database structure:

Apart from the cryptocurrency data fetched in last post, the series of dimensions and metrics we have to work with are the following:
Common Dimensions
- Date
Search Trends Data
- $cryptoCurrency_searchVolume: A number from 1 to 100. Numbers represent search interest relative to the highest point in 2 years. A value of 100 is the peak popularity for the term.
Financial Market
- U.S. 10-Year Treasury Yield: This represents the yield (interest rate) on U.S. government bonds with a 10-year maturity. It is a key indicator of long-term interest rates and is often used as a benchmark for mortgage rates and other financial products.
- U.S. 30-Year Treasury Yield: This is the yield on 30-year U.S. Treasury bonds. It represents the long-term outlook for inflation and interest rates, influencing long-term financial products such as annuities and fixed-income investments.
- U.S. 5-Year Treasury Yield: The yield on U.S. government bonds with a maturity of 5 years. It reflects medium-term interest rate expectations and is often monitored to understand inflation and Federal Reserve policy expectations.
- U.S. 13-Week Treasury Bill Yield: This represents the yield on short-term U.S. Treasury bills with a 13-week maturity. It is closely tied to short-term interest rate expectations.
- U.S. Dollar Index - DXY: The U.S. Dollar Index measures the value of the U.S. dollar relative to a basket of foreign currencies. A strong dollar generally has a negative impact on commodities, including cryptocurrencies, as they are priced in USD.
- NASDAQ Composite Index: The NASDAQ Composite Index tracks a wide array of tech-heavy stocks. Since cryptocurrencies are often associated with high-risk technology investments, there can be a correlation between NASDAQ performance and crypto prices.
- S&P 500 Index: The S&P 500 Index is a broad market index that tracks the performance of 500 large U.S. companies. It's a key indicator of overall stock market health and movements in the S&P.
Like with the CoinGecko Cryptocurrency price data, this is all retrieved daily.
All the tables have one column in common. The date will be our primary key.
Preprocessing Our Macro Indicators
One particularity of the financial data retrieved from Yahoo Finance is that it lacks certain dates. While the Crypto markets are open 24/7, financial markets only operate Monday through Friday and close on certain national holidays.
To deal with that, we had to perform some SQL magic to handle missing dates.
First, we needed to add these missing dates to our table. Since those missing dates would contain null values for our metrics, we created some window logic that retrieved the last non-null value.
In case you want to check the SQL code:
WITH DateRange AS (
  SELECT
    GENERATE_DATE_ARRAY(DATE_SUB(CURRENT_DATE(), INTERVAL 540 DAY), CURRENT_DATE()) AS all_dates
)
 ,joined as (
SELECT
  d AS Date,
  fd.TNX,
  fd.TYX,
  fd.FVX,
  fd.IRX,
  fd.DX_Y_NYB,
  fd.IXIC,
  fd.GSPC,
  fd.VIX
FROM
  UNNEST((SELECT all_dates FROM DateRange)) AS d
LEFT JOIN
  `xxxx.crypto_data_raw.macro_indicators` fd
ON
  d = fd.Date
 )

  SELECT
    Date,
    IFNULL(TNX, LAST_VALUE(TNX IGNORE NULLS) OVER (ORDER BY Date)) AS TNX,
    IFNULL(TYX, LAST_VALUE(TYX IGNORE NULLS) OVER (ORDER BY Date)) AS TYX,
    IFNULL(FVX, LAST_VALUE(FVX IGNORE NULLS) OVER (ORDER BY Date)) AS FVX,
    IFNULL(IRX, LAST_VALUE(IRX IGNORE NULLS) OVER (ORDER BY Date)) AS IRX,
    IFNULL(DX_Y_NYB, LAST_VALUE(DX_Y_NYB IGNORE NULLS) OVER (ORDER BY Date)) AS DX_Y_NYB,
    IFNULL(IXIC, LAST_VALUE(IXIC IGNORE NULLS) OVER (ORDER BY Date)) AS IXIC,
    IFNULL(GSPC, LAST_VALUE(GSPC IGNORE NULLS) OVER (ORDER BY Date)) AS GSPC,
    IFNULL(VIX, LAST_VALUE(VIX IGNORE NULLS) OVER (ORDER BY Date)) AS VIX
  FROM joined
  order by date asc
SQL query used to fowardfill financial data
Now that our data is ready, let's go through the process of reuniting it to its friends.
Joining our Data
The process of joining our data is quite simple.
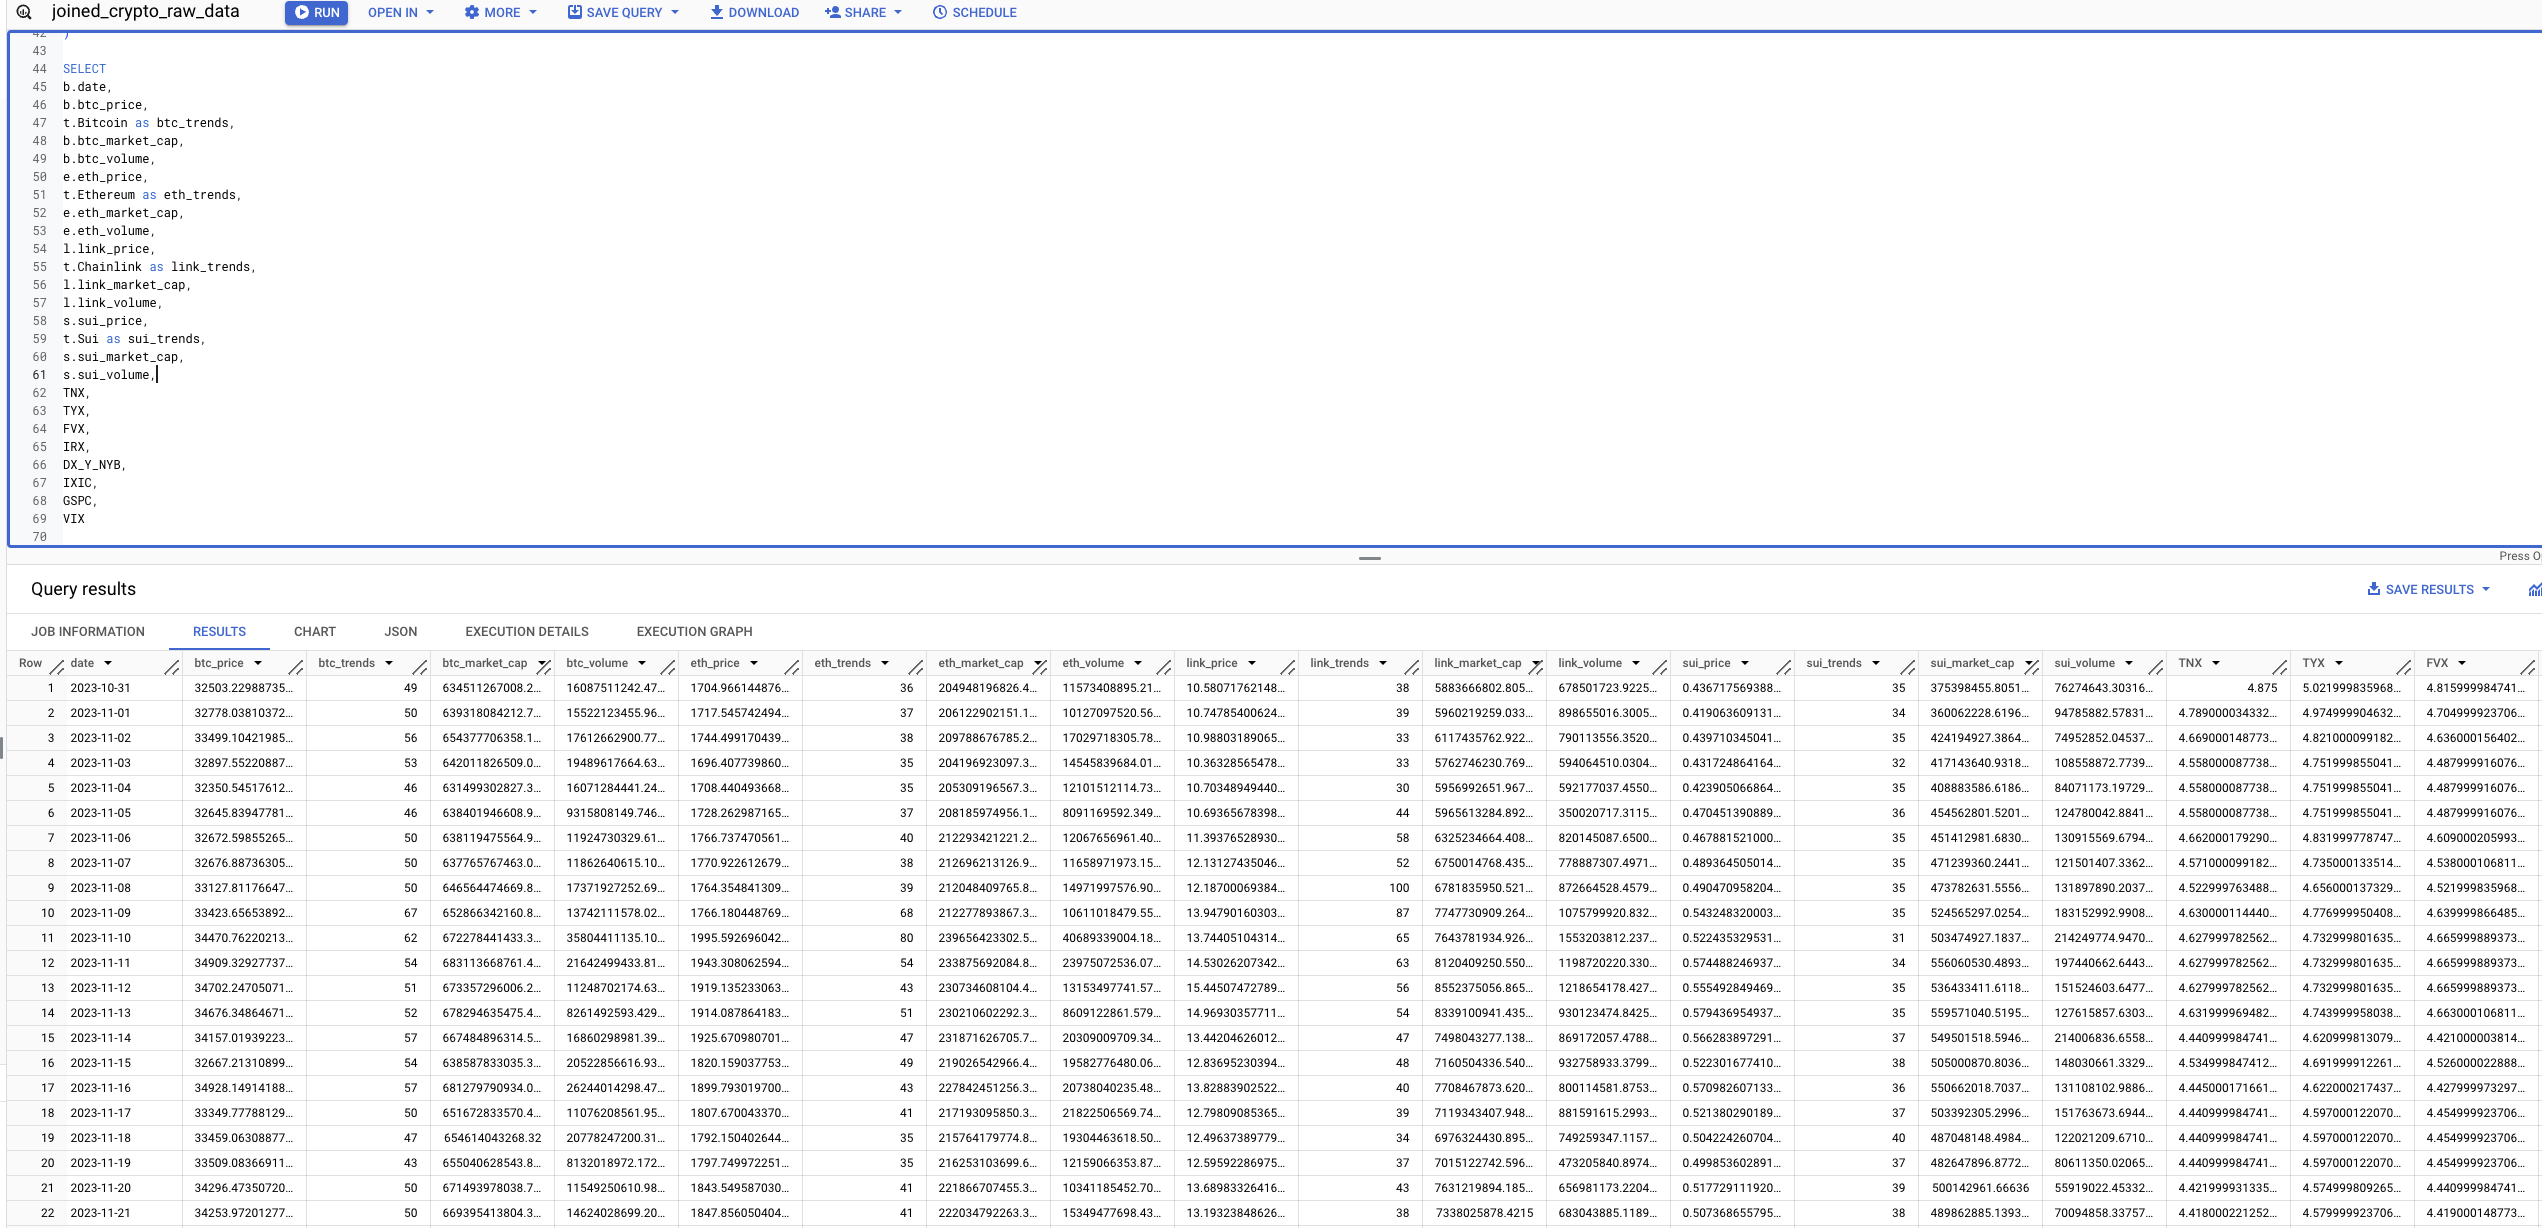
We go into BigQuery and proceed through a series of left joins that give us a table with our date dimension and a column for each of our metrics:

If you are curious about the SQL code, here is how I did it:
WITH bitcoin as (
  SELECT date, MAX(price)btc_price, MAX(market_cap) btc_market_cap, MAX(volume) btc_volume
  FROM `xxx.crypto_data_raw.bitcoin_historic_raw`
  group by date
)
, macrodata as (
  SELECT
  Date,
  TNX,
  TYX,
  FVX,
  IRX,
  DX_Y_NYB,
  IXIC,
  GSPC,
  VIX
  FROM `xxx.crypto_data_raw.macro_data_fowardfill`
)

, link as(
  SELECT date, MAX(price)link_price, MAX(market_cap) link_market_cap, MAX(volume) link_volume
  FROM `xxx.crypto_data_raw.chainlink_historic_raw`
  group by date
)

, eth as (
  SELECT date, MAX(price)eth_price, MAX(market_cap) eth_market_cap, MAX(volume) eth_volume
  FROM `xxx.crypto_data_raw.ethereum_historic_raw`
  group by date
)

,sui as (
  SELECT date, MAX(price)sui_price, MAX(market_cap) sui_market_cap, MAX(volume) sui_volume
  FROM `xxx.crypto_data_raw.sui_historic_raw`
  group by date

)
, trends as (
SELECT *
FROM `xxx.crypto_data_raw.crypto_google_trends` order by date desc
)

SELECT
b.date,
b.btc_price,
t.Bitcoin as btc_trends,
b.btc_market_cap,
b.btc_volume,
e.eth_price,
t.Ethereum as eth_trends,
e.eth_market_cap,
e.eth_volume,
l.link_price,
t.Chainlink as link_trends,
l.link_market_cap,
l.link_volume,
s.sui_price,
t.Sui as sui_trends,
s.sui_market_cap,
s.sui_volume,
TNX,
TYX,
FVX,
IRX,
DX_Y_NYB,
IXIC,
GSPC,
VIX

FROM bitcoin b
LEFT JOIN eth e
ON b.date = e.date
LEFT JOIN link l
ON
b.date = l.date
LEFT JOIN sui s
ON
b.date = s.date
LEFT JOIN trends t
ON
b.date = t.date
LEFT JOIN macrodata m
ON
b.date = m.Date
Exploratory Data Analysis
With our input data ready, we explore data to familiarize ourselves with our dataset.
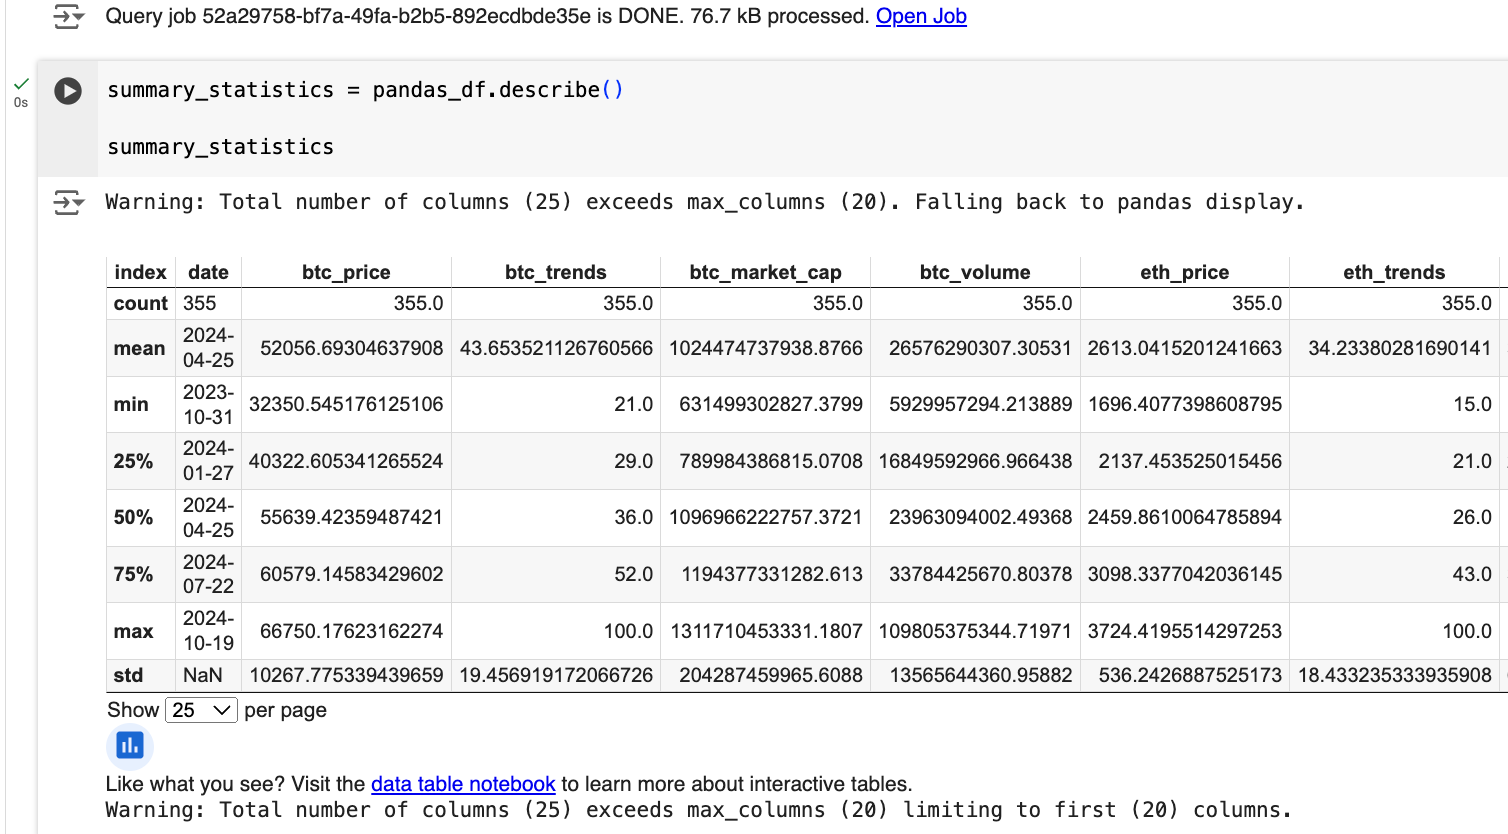
First, we start by getting some summary statistics about our dataset:

Looking at the summary statistics, we start asking some questions:
Volatility Of Prices
- We are curious about the volatility of our currencies or the standard deviation of the daily return. It is interesting to us because of two reasons:
- On the one hand, a highly volatile number will be harder to predict.
- On the other hand, a highly volatile number promises higher short-term price shifts, which might be nice if I want to do some short-term trading.
:max_bytes(150000):strip_icc()/Volatility-89fb205b705c493ba02c00a3fc4964cd.jpg)
Want to know more about volatility? Check this article.
Looking at volatility, we see that the coin with the highest volatility is SUI. A 0.06 volatility means that, on average, the daily return of SUI fluctuates by 6% around its mean daily return.
- This suggests that SUI’s price could swing up or down by approximately 6% on any given day.

Other Insights
- Search Trends:SUI stands out not necessarily for having the highest search volume in absolute terms but rather for having the highest average popularity relative to its search volume over the year (mean = 53).
- Macroeconomic Indicators:Treasury yields show varying averages with moderate standard deviations, indicating slight fluctuations during the period.Stock indices show high variability, with the Nasdaq's average of 16,332 and the S&P 500's average of 5,172.
Correlation Analysis
Next, we look closely at how our metrics relate to each other. We do this by looking at their correlations.

Some interesting insights from our correlation analysis:
Search Trends:
- ETH BTC and Chainlink have weak correlations to their Google Search Popularity, while SUI has a semi-strong one (.64).
- Bitcoin's price strongly correlates with the SUI Search Trend index, showing the highest correlation among cryptocurrencies to search volume (.68).
Macroeconomic factors
- Both BTC price and ETH price have moderate positive correlations with major stock indices like IXIC (NASDAQ) and GSPC (S&P 500) (0.74 for BTC-IXIC and 0.68 for BTC-GSPC).
- 1-year treasury rates are moderately inversely correlated with the price of SUI and Bitcoin and, interestingly, positively correlated with the price of LINK, which seems strange.
Conclusion:
So, where does all this leave us? Well, we’ve successfully assembled a dataset that includes search trends and traditional financial indicators alongside our target crypto coins.
We've also uncovered some interesting patterns and relationships that we will later use in our feature engineering work,
In the next post, we’ll explore how to start modeling this data and turning these insights into something more actionable. Stay tuned because, as we’ve learned with crypto, things can change quickly.

